A Review of The Autism Autoimmunity Project’s “The Epidemic Continues”
(click on graph to increase its size)
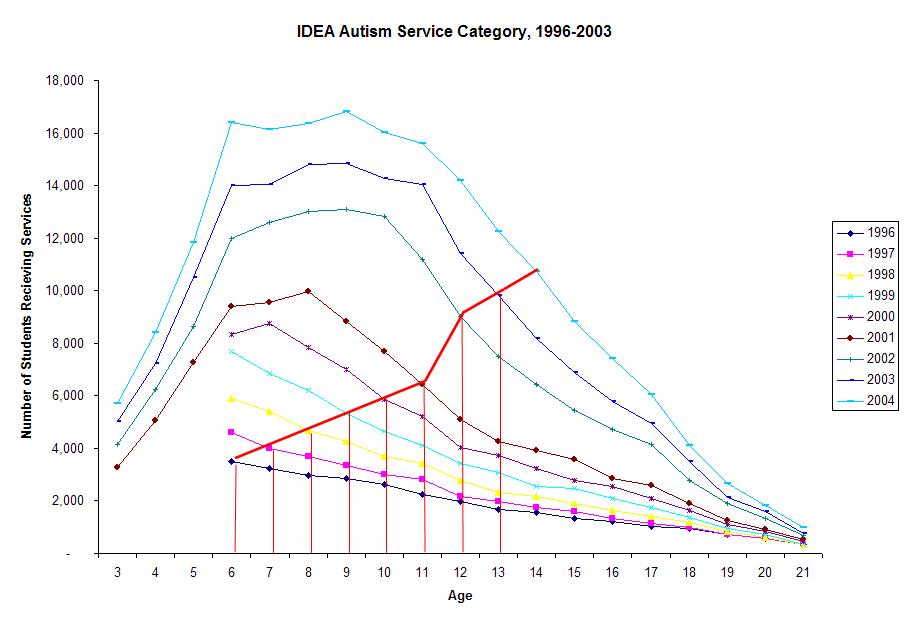
In this post I reviewed the data sets for The Autism Autoimmunity Project (TAAP) (2005). Their Epidemiology section has been recently updated. It now includes data for the 2004-2005 School years. These data are based on the Individuals with Disabilities Education Act (1990) yearly reporting to the US Congress. These data can be accessed at http://www.ideadata.org
I have previously critiqued the use of the IDEA statistics when they are used as epidemiology (a purpose they are analogous to, but do not constitute) as explained elsewhere on this site
http://interverbal.blogspot.com/2005/09/reviewing-autism-prevalence-use-of_20.html
http://interverbal.blogspot.com/2005/10/reviewing-autism-prevalence-use-of.html
http://interverbal.blogspot.com/2005/10/reviewing-autism-prevalence-use-of_06.html
I have attached an updated graph with a heavy red line that shows the 6 year old cohort as they grow older. This upward trend within the age cohorts was noted by Laidler (2005). I also noted it informally in an undergraduate honors thesis early last summer.
In TAAP (2005) the authors present data that shows the trend of increase for the autism service category. It may seem moot to present a separate analysis, however there are several new things to note.
Thimerosal began to be fazed out in 1999 (Center for Disease Control, 2005). It still may be in some vaccinations whose expiration date has not yet arrived and in certain flu vaccinations. It is logical however, to conclude that overall, less thimerosal has been used since that time.
If we assume that overall, there has been less usage thimerosal in vaccines, we can predict that the age cohorts of children after year (2000) will be lower or equal in number of children receiving services compared to the immediately previous year. The overall pattern that would emerge would be a “wave” that slowly travels across the graph as the years go by. It is also logical to predict that this pattern would being to be seen by at least 2004 for the youngest age groups (ages 3 and 4).
This is not seen via the graph. The predictions have “flunked” so to speak. The IDEA autism rise is still going and will very likely continue until it reflects the prevalence rate of the epidemiology as predicted by Gernsbacher, Dawson, & Goldsmith (2005).
References
Gernsbacher MA, Dawson M, & Goldsmith HH. (2005).Three reasons not to believe in an autism epidemic.Current directions in psychological science, 14 (2), 55-58.
Individuals with Disabilities Education Act. (1990). Public Law 101-476, U.S.C.
Laidler, J. (2005). US Department of Education data on "autism" are not reliable for tracking autism prevalence. Pediatrics, 116 (1), 120-124.
The Autism Autoimmunity Project. http://www.taap.info/epidemic.asp
Accessed November 26, 2005-11-28
The Center for Disease Control. July 14, 2005
http://www.cdc.gov/nip/vacsafe/concerns/thimerosal/default.htm
Accessed November 26, 2005
posted by Interverbal at 10:05 AM
![]()

0 Comments:
Post a Comment
<< Home