Reviewing the Autism Prevalence (The Use of the IDEA Data: Part 1)
The Individuals with Disabilities Education Act (IDEA, 1990) was a renaming and a revision of earlier law special education law. The IDEA has since gone through several revisions of its own which can be traced on the US Department of Education website (http://www.ed.gov/policy/speced/guid/idea/idea2004.html).
A yearly accounting of various things including the number of children served in the IDEA service categories are issued by the US department of Special Education to the US Congress every year. It is from these reports that some have begun to track Autism prevalence (The Autism AutoImmunity Project, 2004)
IDEA (1990) created Autism, as a service category in U.S. special education. The IDEA definition is characterized as an assessment of need, not a diagnosis by eligibility alone (Autism Watch, September 15, 2004). This is further complicated by the fact that the States have some freedom to make their diagnostic criteria for Autism more permissive. This seems to be exactly what the States of Oregon and Minnesota have done (Autism Watch, September 15, 2004). These two states have the most students receiving services under the Autism category. In Oregon and Minnesota the diagnostic criteria is permissive when compared to other States. Oregon requires a general agreement from multidisciplinary team that a child meets criteria for Autism, as opposed to an additional separate diagnosis from a professional certified to use the DSM-IV (Autism Watch, September 15, 2004).
The education based data from the IDEA reports to Congress also require some critical thinking. The diagnostic differs from the ICD-10 and the DSM-IV. The US mental health professionals use the DSM-IV. International mental health professionals may use the DSM-IV or the ICD-10. School IEP teams use the IDEA definitions. This is important because, there are discrepancies between the diagnostic systems. A person receiving services under the Autism category of the IDEA may simultaneously be diagnosed with Pervasive Developmental Disorder-Not Otherwise Specified, according to the DSM-IV.
There are other differences as well. In the mental health diagnostic systems, roughly the same percent of persons are diagnosed from their respective racial populations (Fombonne, 2003). So if 1 in 166 White children are diagnosed, 1 in 166 Hispanic children are also going to be diagnosed. This not what we observe in the IDEA data sets.
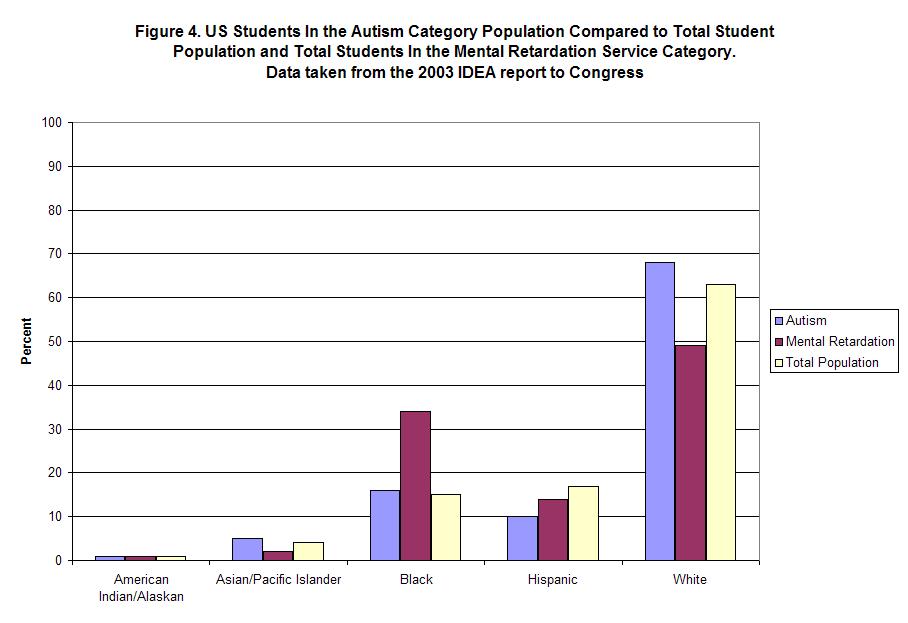
Figure 4, is created from data provided from IDEAdata.org. The overall population comes from the 2000 census projections. I have added in the Mental Retardation data to give an additional comparison group. The data indicate slightly more White students receiving services for Autism than their overall racial percentage. This is a difference of roughly 5 percentage points. This seems only very moderately discrepant from the (Fombonne, 2003) observation.
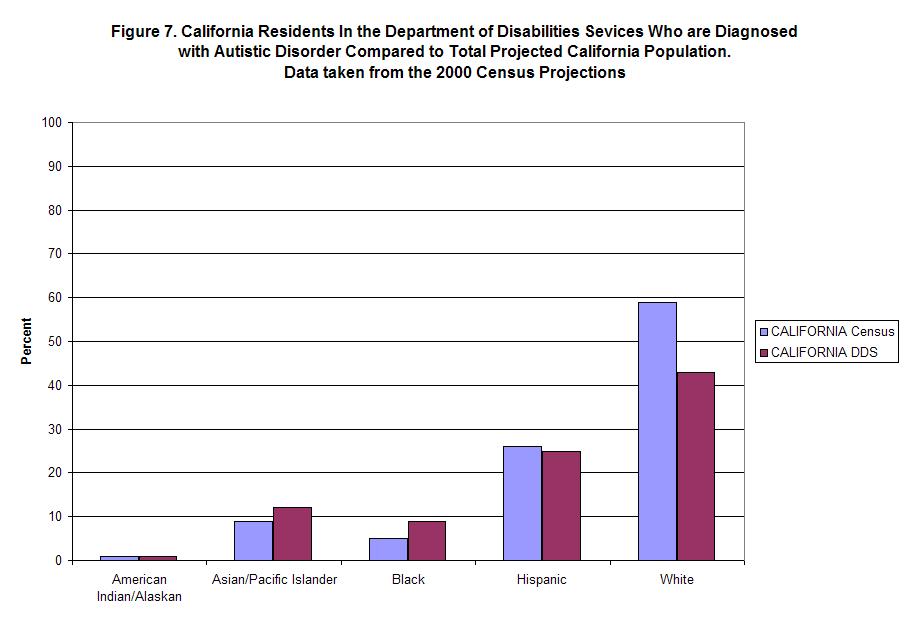
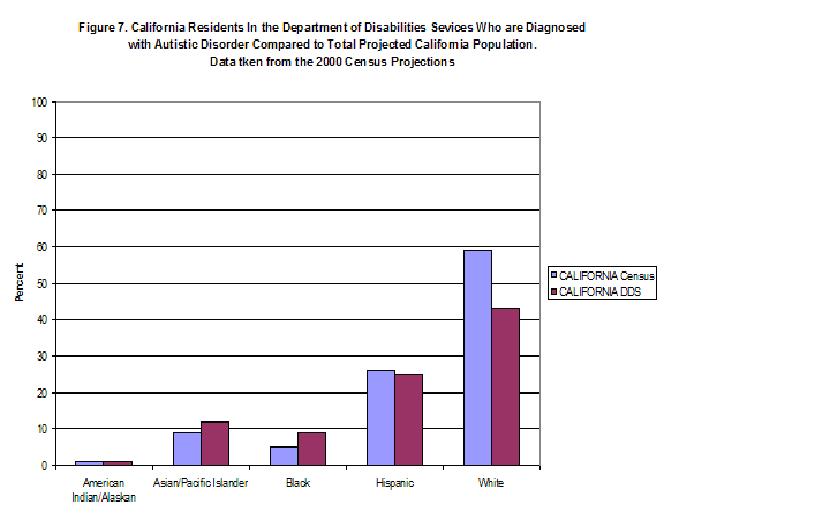
This is more pronounced in individual States. Figure 6, represents the data from California. In California, (11%) more White students receive services than their overall racial percentage. At the same time (17%) fewer Hispanic students receive services compared to their overall racial percentage. The differences in racial categories, concerning receiving Autism category services, seems significant in California and discrepant with the (Fombonne, 2003) observation. Due to this discrepancy it is useful to review the mental health numbers supplied by California’s Department of Disability Services and compare it to the census projections for California in 2003. We can look at this in Figure 7. This is extremely interesting because, the Hispanic discrepancy noted in the education numbers are not noted in the DDS numbers.
So what the heck is going on in California and in whole US to some extent? The disappointing part is, it is not possible to know for sure. We can make some statements that are completely valid however, such as “The IDEA data for autism is different from the epidemiology in several important ways.”
When we go on to consider that IDEA definitions and the DSM-IV-TR serve different tasks and utilize different definitions, is this really so surprising?
References
American Psychiatric Association. (1994). Diagnostic and Statistical Manual of Mental Disorders, Fourth Edition. Washington, DC: American Psychiatric Association; 1994.
Autism AutoImmunity Project. (2004). http://www.taap.info/epidemic.asp.
Accessed September 16, 2005
Autism Watch. Laidler, J. September 15, 2004.http://www.autism-watch.org/general/edu.shtml.Accessed September 16, 2005.
Day, J. C. (1996). Population projections of the United States by age, sex, race, and Hispanic origin: 1995 to 2050. US Bureau of the Census, Current Population Reports, P25-1130, U.S. Government Printing Office, Washington, DC.
Gernsbacher MA, Dawson M, & Goldsmith HH. (2005).Three reasons not to believe in an autism epidemic.Current directions in psychological science, 14 (2), 55-58.
Individuals with Disabilities Education Act. (1990). Public Law 101-476, U.S.C.
World Health Organization. (1992). International Classification of Diseases, 10th Revision (ICD-10). Geneva, Switzerland: World Health Organization; 1992.
posted by Interverbal at 7:10 AM
![]()

0 Comments:
Post a Comment
<< Home