CDDS Incidence Rate per 10,000

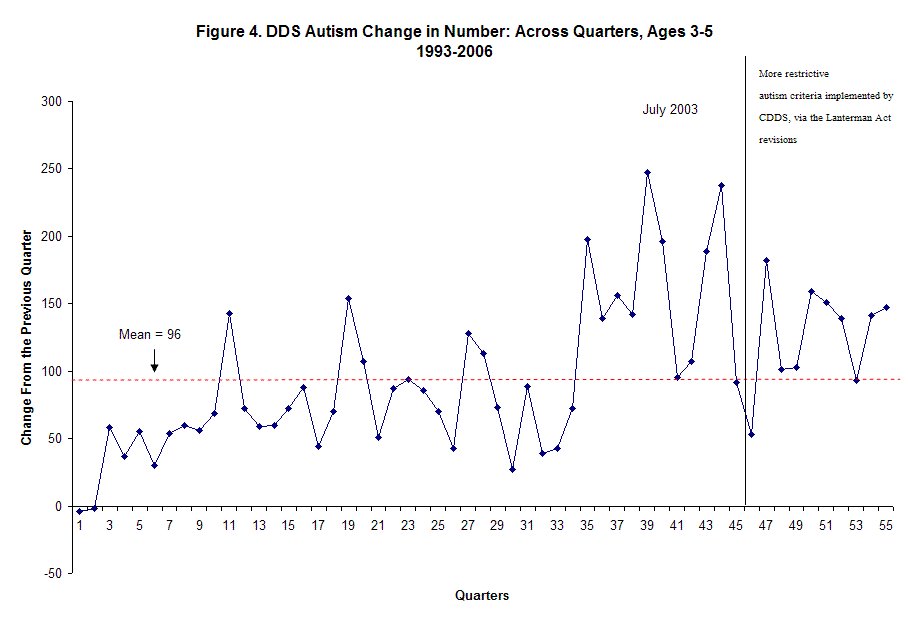
It has come back to me that folks are asking for a incidence rate per 10,000. As you like....
posted by Interverbal at 10:34 PM
9 comments
![]()
A critical look at science in the autism world
posted by Interverbal at 10:34 PM
9 comments
![]()
posted by Interverbal at 11:21 AM
1 comments
![]()
All visitors to this blog are welcome to comment in a manner they see fit. Vehement disagreement is permissible; however comments must be on topic, and must involve actual argumentation. No drive by character assassination or trolling please. Also, no services, events, or research recruitments may be advertised on this blog…period. Violating posts will be removed.

